The purpose of the Community-Forest Profile is to familiarize researchers with the social and economic characteristic of the village and the patterns of human forest interactions in space and time. These methods also provide background which can inform more specialized assessments of vegetation, human organizational, and forest production systems described in later sections. The Community Profiling methods discussed below entail the descriptions of seven different information types (see Figure 5).
Figure 5
PRA Steps for Profiling Community-Forest Relationships
|
1. Background Information ß |
Þ Population census Þ Livestock ownership Þ Land ownership Þ Religious and caste composition |
|
2. Community and Forest History ß |
Þ Historical Transect Þ Time Line Þ Trend Line |
|
3. Community Forest Values ß |
Þ Perceived Ecological Benefits Þ Social and Religious Significance Þ Perceived Economic Value of Products in cash and kind |
|
4. Spatial Information ß |
Þ Sketch Map Þ Product Flow Chart Þ Land Use Transect |
|
5. Temporal Information ß |
Þ Seasonal Calendar Þ Daily Activity Schedule |
|
6. Inventory and Classifying ß |
Þ Species Inventory Þ Gender Specific Inventory Þ Species Use Typology |
|
7. Forest Product Ranking and Scoring |
Þ Product Importance Scoring Table Þ Comparative Product Ranking |
Upon entering the community it is important to collect information regarding the socioeconomic and demographic characteristics of the area. A Community Profile Background Sheet proved useful in earlier PRA exercises in gaining a quick overview of some important features of the village, while also involving community members in a discussion of household-oriented topics (see Community Profile sheet in Vol. U, Appendix 1). All members of a PRA team need to share and discuss community background data early during the course of the study. Basic socioeconomic statistics help identify important sub-groups within the community so that different local perspectives are represented in the PRA process.
Survey questionnaires structure the flow of information. To encourage informal, free flowing discussions, the research team can use the questionnaire as guidelines. It is likely there will be gaps in the information collected during the first day; consequently, the research team should continue to update the baseline information and discuss its implications for the PRA as it progresses.
Forests and communities are both dynamic, interacting elements within larger ecosystems which must be understood in terms of their relationship to one another and how they have changed over time. There may be little written record of these changes, so it may be necessary to interview village elders who have observed how the forest ecosystem and community use patterns have altered over the past 30 to 50 years. In degraded forest areas, it is important to document the processes of ecological change, reconstructing the actors and activities that have affected the forest ecosystem (See Community and Forest History Interview Guidelines, Volume II, Appendix 2).
Local forest officers can usually provide considerable information on the forest history of the research site. Some issues worth pursuing include the history of logging, fires, cleaning and pruning operations, and enrichment plantings (when, what species, how many, survival levels, etc.). Villagers can assist the research team in understanding informal use patterns and pressures, as well as the types of environmental effects they perceive from changes in forest vegetative cover. Other issues to probe with Forest Department staff and communities include: grazing practices (type and number of livestock, periods of grazing allowed, other restrictions, etc.), fuelwood and fodder collection patterns (number of users, volume collected, etc.), surface water and wind-generated soil erosion, changes in microclimate, and changes in water tables, well levels and flooding.
In beginning a discussion regarding the community, ecological, and forest history of the area, it is often helpful to ask a group of older people to reconstruct what the forest was like when they were children. Developing maps, land use and historical transacts of the research area can also illustrate the changes in forest cover and structure over time and their impact on the flow of forest products and local hydrology. To better identify how the structure and composition of the forest have changed, it may help to ask community members to prepare a historical transect of the area. Since this exercise is meant to illustrate community perceptions regarding relative changes in the forest environment and requires remembering the forest structure and composition as long as 50 years ago, recollections should only attempt to approximate conditions in the past (see Figure 6). Experience from other PRAs suggests that it is helpful for participants to begin by drawing the forest at present as a baseline, and then follow with earlier periods. The villagers decide the appropriate time periods to draw; usually three to four periods are sufficient. They can attempt to draw the size and composition of the forest trees in each period, indicating relevant management information at each time segment. For example, they might list the number of different productive species available, the type of management system, periods of logging, rules, rights, and regulations, and advantages and disadvantages of particular systems.
Figure 6: Gamtalao Historical Transect
Time lines can also be helpful in identifying important past events (i.e., droughts, land reforms, forest felling, fires, etc). Historical studies of the area and the Forest Department Working Plan can help identify significant socio-political and environmental events providing a framework for the time line. Oral histories can provide more details on local events, how they were perceived by the community, and their eventual impact on forest management. An example of a time line from Gamtalao village in southeastern Gujarat follows (see Figure 7).
Figure 7: Time Line of Gamtalao
|
1922 |
Original Gamtalao village established |
|
1925 |
Phulwadi falia founded |
|
1947 |
Independence |
|
1950s |
Private land allocation and titling |
|
1968 - 1970 |
Commercial clear-felling of forests in the area |
|
1970 |
Kotwalia basket-makers begin to settle in Phulwadi |
|
1980 - 1987 |
Repeated attempts and failures to reforest Gamtalao area with Acacia auriculiformis and Eucalyptus |
|
1988 |
Circle Conservator and GFD staff hold meeting with Gamtalao villagers to discuss reforestation, community needs and collaborative management possibilities |
|
1988 |
Formation of Gamtalao Forest Protection Committee (unregistered); 25 hectares protected with enrichment planting of local species |
|
1989 |
Gamtalao begins protecting 60 additional hectares; Phulwadi villagers request the people of Gamtalao to allocate 35 hectares of forest land under their protection |
|
1990 |
Gamtalao FPC places 20 more hectares under protection |
|
1991 |
First gobar gas plant set up (12 total) |
|
1992 |
Phulwadi women propose to establish Mahila Mandal |
Trend line graphs are also useful in showing changes in the population, rainfall, and volume flow of important forest products over time (see Figure 8). They can also be used to chart patterns of forest disturbance and regeneration. Information generated during the preparation of a historical transect might show how the diversity of forest products and species has declined over time. Involving community members in discussions of declining or increasing availability of products can also raise a range of important issues. Information on how distances travelled to collect fuelwood, fodder, NTFPs, and water have changed can be depicted in graph form by community members.
Figure 8: Trend Lines for Wood Extraction in Karnataka, 1973-1989
Historically, many communities have been heavily dependent on forests to supply a broad range of raw materials for housing, fuelwood, medicines, tool making, and food. Gums, resins, fibers, and fruits have also been collected for sale and trade in local markets. Beyond their economic importance, forests have provided refuge for rural people when attacked by outside groups. Forests play a role in stabilizing the local hydrology and microclimate, often improving agricultural productivity and ground water availability. They provide a home for birds, animals, and insects which can control agricultural pests. Forests also provide an escape from the pressures of village life. They serve as a meeting ground for women, and frequently have great religious significance for tribal communities. Traditional tribal songs and poetry are replete with images of the forests, reflecting its centrality in the culture, economy, and World view. Many forest tree species such as mahua, ficus, and sal, as well as animals and birds such as monkeys and peacocks, take on totemic importance and receive special protection by the community.
PRAs indicate that rural communities are well aware of their heavy dependence on the forest and are concerned when forests are threatened by overuse and degradation. Establishing more effective management systems depends on the motivations of the community and their perceptions of the value of the forest. Understanding the economic, social, and religious significance of the forest to local groups reveals the degree of commitment they may have in sustaining these threatened ecosystems. Community values of the forest may vary among men, women and children in the village. Consequently, interviews should be conducted with different types of community members to assess their management priorities, perceived needs, and incentives to contribute labor and resources toward forest protection. In some cases it may be preferable to hold these discussions in the forest where members can observe and identify important aspects. It may be useful to begin with a question about the most important benefits of the forest and then to gradually pursue more specific functions such as religious, socioeconomic significance, environmental functions, and the forest's relationship to agricultural and livestock management systems.
Through interactive exercises with the community and observation, the research team can help create a picture of spatial resource use patterns by developing sketch maps, product flow maps, and transacts of resource use patterns. The main purpose of diagnostic sketch-mapping is to create a visual representation of the resource system which can be easily understood by both villagers and foresters. An alternative to traditional mapping, participatory sketch-mapping has been developed successfully with communities in many parts of Asia. Prior to beginning the exercise, the research team needs to explain to community members the purpose of the mapping activity as a way to learn more about the forest's condition and community use patterns. A suitable site for map construction should have a large, flat area where community participants can relax and work without disturbance, possibly off the road under a tree or in a communal courtyard.
The team should first request participants to draw a map of their village and adjacent forest areas on the ground, utilizing stones, twigs, leaves, seeds and other local materials to identify characteristics. The process should proceed with as little intervention as possible by the researchers. Villagers often debate what characteristics are important, and as a result, a wide variety of relevant and unexpected information may emerge. Ground maps can be recorded both by photographing and copying onto a large sheet of white paper or previously prepared base map. The maps can serve as a focal point for discussions on forest-related resource issues.
In one forestry PRA, the sketch-mapping exercise was held in the school courtyard. The mapping began with a demarcation of roads, settlements and rivers which were drawn in the gravel with a stick by the teacher. The researchers suggested some local materials might be used to highlight these features, so the school teacher began involving his students in procuring ash, dirt of various colors, leaves, flowers and other materials. The use of a wide range of local materials was an effective method to involve the students in collection and decisions on how to depict landmarks. The colorful ground map which resulted attracted the interest of many community members, drawing their comments and suggestions (see Figure 9). The earth sketch map was later drawn on a large sheet of paper and taken to the forest for ground truth checking (see Figure 10). This involved walking and driving through the forest, and stopping periodically to check features on the map. A final map integrating more information was prepared by an artist after the originals were returned to the communities (see Figure 11).
Figure 9: Limbi Ground Sketch Map
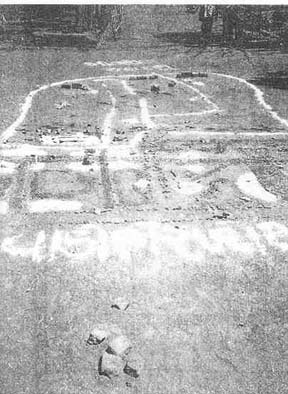
Figure 10: Drawing of Limbi Sketch Map
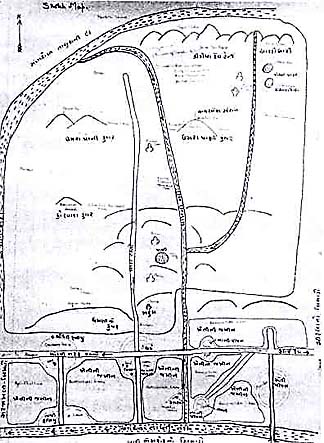
Figure 11: Artist's Rendition of Limbi Sketch Map
More specialized maps can be drawn based on PRA discussions and field observations. Maps of use routes, collection areas, and informal usufruct areas are especially useful for holding follow-up discussions regarding new management systems (see Figure 12). A map of forest condition and standing stock levels can also be helpful in determining sites for vegetation measurement and the impact of existing use practices (see Figure 13).
Figure 12: Flow Routes in Nawanagar, Pinjore, Haryana
Figure 13: Forest Conditions in Nawanagar, Pinjore, Haryana
Working with villagers to draw land use transacts can also provide a valuable perspective on the types of ecosystems and use patterns in the area. These can be drawn while sitting on a ridge, roof top, or other elevated place with a group from the community. While sketching the transect, it is useful to distinguish major zones of land use and topography (hill top, forested plain, agricultural land, village, river, etc.). Under each zone, the community can list important information such as species composition, economic activities, and management problems and opportunities. Figure 14 illustrates a 3 km, transect of Chandana forest area in southeast West Bengal.
Figure 14: Land Use Transect in Chandara, West Bengal
|
Land Use Types |
River |
Fields |
Village Bamboo & Fruit Trees |
Degraded Sal Forests |
Protected Sal Forests (7-8 years) |
Village |
|
Management Problems |
- River bank erosion - Flooding |
Rainfed, marginal farming, small holdings |
Heavy dependence on fuelwood headloading for income. Lack of unity on effective FPC functioning |
Overcutting and overgrazing of sal coppice growth Soil erosion |
Rapid sal regeneration under effective FPC protection - continued threats from neighboring villages. Inadequate intermediate product flows |
Lack of access to low cost rice (padi) High interest rates on loans |
|
Management opportunities |
- Bamboo planting on banks - Bank stabilization with low cover shrub vegetations |
Fodder and fast growing fuelwood species (trees and shrubs) on bunds |
Develop small NTFP industries: leaf plates, mushroom cultivation, bamboo products |
Form FPC and establish access controls. NTFP species, enrichment planting, target headloading families specifically |
Encourage FPC's of neighboring villages to act cooperatively Allowing more rotational felling and thinning with NTFP enrichment planting |
Storage facility for grain for rice pounding Establishment of FPC bank account and credit system |
In order to document the flow of forest products over time and better estimate yields, it is important to determine how product collection changes over the seasons. This can be done by working with community members to develop a seasonal calendar of forest product collection activities. If villagers list a great number of forest products during the inventory exercise, it may be best to limit the seasonal analysis to products given high priority scores in each type class (e.g. three to five fodder products, fuel products, edible products, etc.) All products with commercial value, either sold in raw form or processed, should be included in the calendar.
Other PRA studies in India have shown that it is helpful to study seasonality by placing twelve stones in a row on the ground, with each one labeled with the local name for the appropriate month. Participating villagers are asked to indicate which months each product is available. Only one product or type of product should be discussed at a time. The villagers can use seeds to show the relative availability, indicating low and high yield periods. After each product or type of product has been indicated, the information should be recorded by photographing the calendar and transcribing it onto paper. After recording, the next product or type can be discussed and laid out on the ground calendar. Calendars can also be effectively portrayed in a circle as shown in Figure 15. If the research team and participating villagers have time, they may also want to draw a seasonal calendar showing the high and low periods of labor input into agriculture, forestry, and other production systems. The villagers can indicate peak demand periods for different types of forest products like fodder, fuel, food, and raw materials.
Figure 15: Seasonal Calendar of Forest Product Flows, Gamtalao

The preparation of daily activity schedules can help identify labor allocation patterns. One PRA found that beginning a semi-structured interview with women by preparing an activity schedule served as an effective icebreaker because it dealt with familiar routines, was a comfortable topic, and promoted group consultation in which 4-5 of the women reached consensus regarding their typical day-to-day schedule (See Figure 16). Daily activity schedules can be cross-checked by spending a 24-hour period in the village and timing activities. Labor allocation data can then be used to calculate labor costs for the collection, processing and marketing of different forest products.
Figure 16: Daily Activity Schedule of Women in Moti Pipal, Limbi Panchayat
|
4 am |
|
|
5 am |
Wake-up: Sweep |
|
6 am |
Fetch water (Milking) |
|
7 am |
Breakfast cooking |
|
8 am |
To forest for fuelwood |
|
9 am |
" |
|
10 am |
Walk roundtrip with headload to Ukai dam and sell |
|
11 am |
|
|
12 noon |
|
|
1 pm |
Return home: wash clothes |
|
2 pm |
Grind Grain |
|
3 pm |
(Milking) |
|
4 pm |
Fetch drinking water |
|
5 pm |
Free time with children |
|
6 pm |
Begin cooking dinner |
|
7 pm |
|
|
8 pm |
|
|
9 pm |
Sleep |
It is well established that many forest communities throughout the Asian region have considerable understanding of the forest ecosystem and its species composition. Ethnobotanical studies demonstrate that tribal and some non-tribal people who have strong ties to the forest can identify hundreds of productive species and their uses as sources of foods, medicines, fiber and construction materials, gums, dyes, tannins, etc. Using secondary data and local resource specialists, this information can be collected for the case study sites. As a prelude to fieldwork, books or reports should be obtained listing all the forest species found in the area, ideally giving local names and uses.
A number of enthnobotanical methods have been developed to inventory non-wow forest products which can be adapted by the research team to the particular needs of the study area. While many of the fruiting, flowering and seed-bearing species only yield products during the dry season, other products such as mushrooms may only be available during the monsoon. While it may be possible to inventory many species at one point in time, to collect information on production levels research teams win need to ask villagers to recall what they collect throughout the year.
The community can begin by listing all forest species used for subsistence or commercial use, classified according to important uses which they identify. The resulting "folk typology" may reflect categories such as: edible flora (mushrooms, fruits, oil seeds, nuts, flowers, tubers, leaves, stems); edible fauna (including insects, honey, fish, animals, birds); construction materials (timber for roofs, house walls, agricultural tools, grasses and barks for rope); medicinals (leaves, bark, roots, stem, seeds, fruits); fuels (trees, shrubs, leaves, grasses); fodder (trees, shrubs, leaves, grasses); and others (gum, resins, lac, toothbrush sticks, etc.) Once the important use types have been identified, the name of each category should be written in the local language on large pieces of poster paper, and the community encouraged to list all the local names of each species under each use category. A separate column should list the parts of the plant utilized.
Since it typically requires one to two hours with a small group to complete the initial listing of species, this exercise should be done when the villagers have time to think carefully and are not under pressure to perform other tasks. Separating groups of men and women to list forest species can create a competitive atmosphere which facilitates a more thorough listing and indicates gender-specific knowledge. Species lists can also be cross-checked and further elaborated by walking through the forests with knowledgeable local informants. Walk-throughs can focus on specific use categories, identifying all species used for medicines, fodder, or edible foods. The advantage of conducting a walk-through is that it also allows the researcher a chance to see where different species are located. During harvest periods, the researcher can observe product collection techniques, photograph harvesting processes, interview collectors, and record volume or weight measurements if a scale or tape measure is brought along.
In addition to classifying, researchers can also assess the relative importance of different forest products to the community. To facilitate the comparison, it may be best to allow the villagers to compare products within each type of use (i.e., fodder, fuel, food, etc.). Each type of product can be represented by its local name, a picture, or the actual object, listing these products on the ground or on a piece of poster paper. PRA exercises in India have found that the relative importance of each product can be determined by providing village participants with a fixed number of seeds or stones to award scores. If 5-15 products occur in a use type, the villagers can be asked to place the number of stones or seeds next to the name, picture or object to reflect its importance in relation to other products on the list. The participants may need some time to agree on a score, and men and women may wish to score the products differently, in which case two columns should be used.
During earlier PRAs, both ranking and scoring techniques were used by community participants. Ranking indicates the degree of importance given to each item, while scoring is a comparative measure which provides an indication of their magnitude of importance in relation to each other. Community participants had little difficulty in understanding the scoring method, and once familiar with the procedures, they conducted the exercise with considerable interest. Most of the scoring exercises were carried out in small group discussions, at times stratified by socioeconomic group or gender. In scoring exercises, it is important that the researchers attempt to assess the criteria that the participants are using, whether it is commercial value, strength, ease of collection, nutrition, etc. Criteria will generally vary by use type. For example, villagers may give higher scores to fuelwood species which 1) produce less smoke 2) are easy to cut or collect and 3) burn longer or hotter. By investigating criteria for evaluation, the research will uncover considerably more information about why certain species are more valuable than others. Once the rankings have been completed and tables drawn up, the researcher may want to return to the village to further explore the rationale or criteria used in scoring different species by use. Since there may not be sufficient time to acquire this knowledge during the first scoring exercise, a follow-up session could be very useful.
Data from scoring exercises can be displayed in tables as shown in the Phulwadi village forest species example (see Figure 17). It is important that the researcher explain the significance of the different scores given. For example, why is teak ranked so much more highly for agricultural implements than other timber-bearing trees? Ranking and scoring techniques can also be used to determine priority management problems and options perceived by the community or forestry field staff.
Figure 17: Scoring of Forest Species by Use, Phulawadi Village
The community profile generates a broad picture of local forest use practices. This information can be used to design and inform follow-on studies of vegetative change, institutional conditions, and the economics of forest production systems. For example, sketch maps and forest use history should guide the selection of study plots for assessing vegetative conditions. Information on the community's social composition can help identify important groups and organizations for institutional analysis. Finally, profile data on daily and seasonal work patterns, product flows, product inventories, and priority scores can identify issues and provide a basis for designing the economic analysis of forest production systems.