The economic assessment methods presented here are designed to build on information collected during the preliminary PRA Community-Forest Profile discussed in Part III A. The profile should have generated an understanding of the patterns of forest use in space and time, important forest products, their collection and users, marketing and processing flows, and some of the key local forest management issues. This initial background information is also complemented by the more detailed studies on the multiple aspects of forest vegetation (including species structure, composition and productivity) described in Part III B, and with the community- forest department socio-institutional analysis discussed in Part III C. These earlier studies will generate many management questions as the field data are sequentially organized and analyzed. One area where additional in-depth information will be needed is in assessing the economics of forest production systems.
In the following pages, techniques are presented to estimate the volumes and values of forest products collected, harvested, and processed by forest communities. Discussion of these methods includes: calculating volumes flows, labor and capital costs, product prices, processing and marketing, and financial analysis for assessing forest production systems. In Figure 30, a chart is presented to demonstrate the relationship between these management issues, suggested research questions and proposed diagnostic methods. In many cases, supportive and complementary information generated from the community profile, vegetative assessment, and institutional analysis can be used to help answer the management questions. Figure 31 reviews the sequence of economic research activities that may be used.
Figure 30:
Economic Issues, Research Questions, and Methods
|
Issues |
Question | Methods |
|
1. Product volume flows and values |
- What are the annual yields of timber and NTFP? - What proportion is commercially sold and how much income does it generate for collectors? - What is the substitute value of forest products used for home consumption? |
- Interviews with collectors - Participant observation during collection activities - Interviews with stratified social groups - Market visits to determine prices, volume and substitution values |
|
2. Labor and capital costs |
- How much labor is allocated by individuals and households for collecting, processing, and marketing of different forest products? - What recurring and fixed costs are associated with forest production activities? |
- Daily and seasonal activity schedule - Seasonal calendar - Interview collectors, processors and middlemen to identify equipment & related capital costs |
|
3. Product Prices |
- What have been the trends in market prices over the past ten years? - How do they vary between markets? - How do prices fluctuate during the year? |
- Interview middlemen, FD staff and collectors - Check FD records and policies - Conduct market visits across seasons for seasonal price calendar |
|
4. Processing and marketing |
- How does the quality and availability of raw materials compare with the requirements of processors? - What value additions are obtained through processing and how could profits be increased? - How effectively do current market linkages meet the needs of village producers? |
- Interview artisans to documents raw material requirements and supply - Analyze processing system in use flow chart - Conduct market linkage study and analyze profit margins |
|
5. Financial Analysis of Forest Production Systems |
- What are the benefit and costs of different production-oriented management options? |
- List non-monetized values for each option - Calculate Benefit Cost ratios and Internal Rates of Return for different management investments |
Figure 31: Steps in Conducting Economic Assessment of
Forest Production Systems
It is best if the economic evaluation is conducted during the collection season. In India, many important non-timber forest products are gathered during the months of April through June. This scheduling allows the team to directly observe and participate in collection activities, measure the volumes of products being collected, and interview participants while the experience is fresh in their minds. The research team should allow at least three days of field time for this phase of the study. The size of the study area influences the time required. For example, a single hamlet with a small 60-hectare tract of forest can be assessed much more quickly than a 5000-hectare forest with multiple user communities. The team should also consider transit time between lodging, community, forest area, forest office, and markets in planning its schedule. In addition, several days should be allocated for preparing question guidelines and establishing a research activity plan. Time should also be designated for analyzing and writing-up the findings during and after the fieldwork is completed. If the research team decides to seek more in-depth information through extended participant observation in collection, processing, and marketing activities, or wishes to conduct a stratified sample survey, additional time should be budgeted.
PRA studies in India indicate that through key informant and group interviews, researchers can gain reasonable estimates of volume flows for important forest products. In most cases, fuelwood, timber, and fodder will be of central importance, however a range of NTFPs may have considerable local economic significance and will also need to be assessed. Economically important forest products and seasonal collection patterns will already have been identified during the community-forest profile exercise. While initial interviews for estimating volume flows may generate conflicting estimates, additional interviews and in-depth cross- checking generally can clarify discrepancies and provide fairly consistent results.
It is useful to begin with a group interview, and then to follow-up with individual interviews of at least two or three other regular collectors. By interviewing members of neighboring communities and villagers of different socioeconomic backgrounds (i.e. stratified sampling), researchers can determine how collection activities and forest dependencies vary among households. Key informant interviews with local foresters, middlemen, processors, traditional herbalists, women collectors and village leaders can provide more in-depth information on special topics.
To introduce the discussion of product volume flows, it is helpful to initially inquire about collection practices (who, what, when, where, how), and to establish how many members of the forest user community(ies) are involved in the collection of that product. Men, women, and children should be distinguished if collection practices and volumes vary. Villagers can help correct one another in attempting to reach a consensus on the average volume collected on each forest trip. This information should be cross-checked with the seasonal calendar developed during the earlier PRA to estimate how many collection trips are made during the harvest season and how the volume harvested per trip may vary across the seasonal collection period. It may be helpful to refer to the sketch map developed earlier in order to determine the collection area. During the group and key informant interviews, the following questions may be raised, using follow-on questions to pursue issues, verify, and clarify responses:
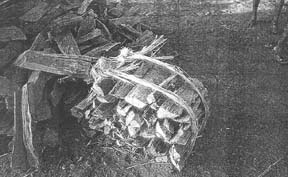
It is easiest to work with a single product or one class of products at a time, focusing on the collection process sequentially for each of the most important products. To ease recording, a data sheet has been developed (see Figure 32). The unit of collection (baskets, bundles, bags, weights, pieces) should be identified and later translated into an appropriate standard volume or weight. Since local collection units may vary depending on the size of the container or the strength of the individual, it is best to establish a mean unit weight or volume as the average collected per trip (weigh or measure a sample of loaded baskets, bundles, etc. to determine the mean; see Figures 33 & 34).
Figure 32: Data Sheet for NTFP Collection
|
Name of Species |
Forest Product |
Collection period |
# of collection trips/yr. by household members |
Amount of Time spent/trip (hours) |
Number of Collectors: using Forest Area |
Amount collected per trip |
Price received by collector |
|
e.g. Bassia latifolia |
flower |
April 10-30 |
G : 2 E : 6 C: 4 |
G : 4 hrs. E : 5 C: 5 |
40 |
G : 4 kg. E : 3 C: 2.5 |
Rs.2.5/kg dry |
Figure 33: Basket Volume of Mahua Flowers
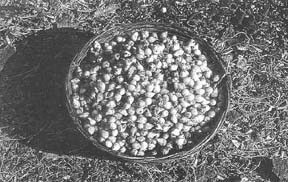
Figure 34: Small Fuelwood Bundle (baadas) for Market, Limbi
Cross-checking the yield data with informed individuals in the community will help confirm accuracy. For commercial products, it may be possible to check with local buyers, forestry field staff, community leaders and teachers to confirm production volume estimates. PRA-generated estimates should also be cross-checked with data from the vegetative standing stock inventory. Through this type of "triangulation" based on multiple and differing sources, it is possible to assess the consistency of the information collected. Once a general agreement emerges in terms of production volumes for a given product, the researcher can assume that the findings reflect the general practices and perceptions of the community.
During the interview process, it may become evident that villagers from different socioeconomic backgrounds vary in their collection activities. To capture this variation more systematically, it may be useful to follow-up by collecting information from a small stratified sample of households. From each of the major social groups in the local community or hamlets (i.e. landless, tribals, migrant), three randomly selected households with husband, wife, and children as informants can be interviewed.
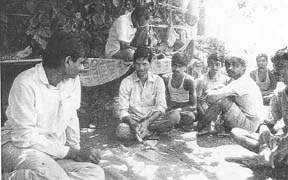
Participating in a forest product collection activity with men, women, or children is one of the best ways to further explore and cross-check volume estimates, collection time and procedures, amount of variation in volumes by different collectors, size and location of collection area, routes, and any informal or formal usufruct rights or rules governing collection. Thus research method often involves arranging to accompany A collector the day before, leaving early in the morning, walking up to 5 to 10 kilometers, and spending anywhere from a few hours to several days in the field. On-site group and individual interviews can be conducted during collection activity breaks in the forest, where products, materials, techniques and hands- on experiences can be directly referred to (see Figures 35 & 36).
Figure 35: Group Interview with Mahua Flower Collectors in
Limbi Forest, South Gujarat
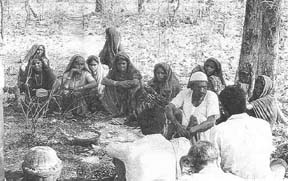
Figure 36: Group Interview with Tribal Members of
Saraja Mali Forest Labor Cooperative Society in Limbi Forest
There are numerous ways to analyze and interpret information emerging from the above methods of estimating volume flows. The type of data collected is most suited to understanding flows into the household. Additional analysis may also provide estimates regarding total flows into the community on a seasonal or annual basis. In some cases, where the collection area is clearly defined, it may be possible to estimate product yield on a per hectare basis. If the collection territory is unclear, a productivity assessment is still possible by utilizing the vegetative data on the density of productive species and individual plant/tree size, distribution, and yield information. The information collected should help illuminate the relative importance of different forest product-based activities for the household economy and community as a whole. Analysis can indicate the proportion of families involved in the activity, their annual income and employment generated from each activity, and, if feasible, the yield of the forest product per hectare.
In order to assess the economic significance and financial viability of forest product activities, it is necessary to estimate the labor, equipment and capital costs related to harvesting and processing activities. This information may be gathered through two or three in-depth interviews with collectors. The seasonal calendar and discussion of collection practices conducted during the initial PRA will have already indicated the duration of the forest product collection season. This step requires a more careful review of time allocations. Requesting knowledgeable people in the community to prepare a daily activity sequence can identify the time spent in collection and processing, as well as its relation to other agricultural and household work in order to compare estimated net returns per hour. To cross-check and average data, labor allocation information should be gathered from at least three collectors of different ages and sex.
The researchers will also need to assess fixed costs related to the equipment used in harvesting and processing. This includes the cost of knives, axes, baskets, machine presses and other implements. The team should find out from forest users how long the equipment can be utilized before replacement is required. Where relevant, capital costs should be assessed through interviews. Ideally, the researcher should observe and participate in the collection, processing, and marketing activities to confirm labor expenditure estimates. Participation will also allow the research team to identify tools and their fixed costs, as well as recurring expenses for materials and transportation. Researchers may wish to elicit community suggestions regarding ways to make the current labor allocation and equipment requirements more cost effective.
Labor allocation for forest product collection and processing can be estimated by drawing a daily or weekly activity sequence with a key informant group of collectors. If the complete activity (including collection, processing and marketing) occurs in a single day, the daily activity chart can capture the entire process. However, if the process requires a number of days, an extended calendar needs to be used. Recent PRAs in Gujarat using activity schedule diagramming indicated that logging and liquor distillation are far more profitable on a daily basis than other extraction activities. However a seasonal calendar further illustrates that both logging and liquor distillation opportunities are limited, so that fuelwood headloading becomes by far the most lucrative activity on an annual basis. Unfortunately, these activities are either currently being carried out at unsustainable levels Ongoing and headloading), or are illegal (distilling). Increasing the productivity of the alternative forest activities through enrichment planting, and improved value-added processing and marketing, could make these systems more sustainable and attractive economically while also absorbing more labor. The analysis of such data should be discussed with community members, who can explain current use practices and problems as well as offer alternatives that they might support.
In assessing market values, prices should reflect what village collectors/processors receive for selling the product (wholesale), either to buyers who come to the village or at local markets, rather than what village buyers pay (retail). Since prices may vary by markets and season, at least two to three local markets should be sampled to obtain prices at several periods during the year. The price listings for forest products should reflect the mean price received by village collectors during the year. Local market price data should be cross-checked with at least three village collectors to confirm consistency. It may also be useful to learn how market prices for important products have fluctuated over the past ten years. Earlier forest product PRAs in India indicate that gathering information on wholesale prices for commercial goods is fairly straightforward, although prices often vary considerably across markets and among buying agents. Researchers need to check a number of markets and local buyers to establish average price levels. They also need to clarify how prices are set and why they vary between buyers and markets. A data sheet for product market price assessments is provided in Figure 37. Questions to guide the interview might include:
Do you sell forest product X?
How much do you sell and how much do you consume at home?
To whom do you sell? How much do they pay? What is the final retail price in the market?
Are there any other places to sell product X?
How do prices rise or fall during the year?
How have prices changed over the past five to ten years?
Figure 37:
NTFP Market Price Data Sheet
|
Species |
Product |
Market 1 |
Market 2 |
Market 3 |
Mean Price |
|
Chun Alu |
Tuber |
Rs. 3/kg |
Rs. 2.50/kg |
Rs. 4/kg |
Rs. 3.16/kg |
|
Sal |
8 cm. DBH pole |
Rs. 22 |
Rs. 14 |
Rs. 19 |
Rs. 18.33/ pole |
In fact, most forest products are not sold, but rather consumed at home. While there are limitations in trying to price goods outside the market place, a number of methods can be used to approximate monetary value. One technique is to determine a substitute value. For example, villagers may consume tubers as a high calorie, low cost food source during periods of scarcity. if they are asked what they would use as a substitute if no tubers were available, a price can be imputed (e.g. if they would buy cassava, the per kilo price of cassava would be the substitute value for the tubers). Similar methods can be employed for fuelwood, fodder and other forest products, although items harvested periodically in small quantities are more difficult to assess volumetrically and economically. In such calculations, care must be taken that weight or volume units are comparable or convertible. For edible forest products, it is also possible to determine their nutritive, rather than economic, value by estimating caloric or vitamin/mineral inputs. It may be easiest, however, to interview families for estimates on what proportion of its food comes seasonally from the forest. In this case, one could sub-divide by staple food (e.g. vegetables, meat, and fruit) or other use categories suggested by community members.
This phase of the research should be able to assess average market gate values of important forest products, stability of market prices over the season, and trends through the years. Rising prices may reflect growth of markets or shortages, whereas seasonal price fluctuations may indicate opportunities for collectors to store products in order to later take advantage of seasonally higher prices. Finally, an assessment of the importance of the forest for subsistence needs, using substitute values during high and. low price periods, would help reflect the economic value of maintaining the land under forest, and the opportunity costs of converting it to an alternative land use.
To assess potential income flows from community managed natural forests, it would be useful to explore in-depth the values of selected commodities in village, district, national, and international markets. Since numerous forest products exist, assessments can be conducted on a select number that have the greatest commercial potential or subsistence importance. One to two commodities could be chosen from a range of use categories (medicinals, food products, fibers and building materials, gums, dyes, tannins, insects and animal products) and tracked through the marketing system to establish pricing patterns at each market level. Figure 38 provides an example of a processing and marketing flow chart for sal plates in southwest Bengal.
Marketing studies need to examine profits of collectors/producers, processors, and middlemen to determine whether changes in processing and marketing patterns might enhance the profitability of products for community forest managers. Documentation of the processing and marketing sequence and the prices at each step can be determined through discussions with involved village members, buyers, and local forestry staff. The sequence can first be sketched on the ground for discussion purposes before copying onto paper. At the same time, it is preferable to combine recall information with actual observation and participation in the commodity production process. Through direct observation, information on labor allocation, costs, production volumes, and prices can be cross-checked. While observing the step-by-step process, researchers have additional opportunities for photographic documentation and for exploration of specific issues or problems experienced by those involved.
Documentation of the collection and production system, including marketing linkages, should assist villagers, foresters, and researchers in determining how the production process might be made more efficient, equitable and profitable. Identification of high profit margins by middlemen or intermediate processors may help guide programs in transferring value additions directly to collectors and producers.
Many commercially valuable forest products are threatened by overexploitation as collectors attempt to gain a marginal income. Often in competition with each other, they may use harvesting methods which not only overextract desired resources, but also damage future productive yields, potentially even resulting in localized extinction. In other cases, important forest products can be sustainably harvested because collection simply involves the gathering of fallen seeds, fruits, leaves, etc. Certain forest products decrease in availability as natural succession takes place. Fodder and fiber grasses, after impressive increases in production occur once protected, often decrease in availability as the tree canopy begins to close and shade the forest floor.
Methods described in the vegetative analysis section will help to determine whether the population of productive species is stabilized, increasing or decreasing. Simultaneously, it is possible to assess directions of change through interviews and observation. Direct participation in a collection trip allows the researcher to observe how the products are harvested and any resulting disturbance to the host plant. In-depth interviews with villagers can provide descriptions on how product availability is changing and on their own perceptions of causes and consequences.
Different methods can be used to assess potential returns for forest production options. Traditionally, financial assessment calculations consider direct benefits and costs for capital investments. In the natural resource sector, experience indicates these valuations may fail to consider indirect social and environmental costs. Alternatively, it is possible to estimate the value of different investment strategies based on community members perceptions of potential returns and benefits. Such assessment methods may better reflect non-monetized impacts as well as represent community priorities.
Community members and local foresters may discuss and share ideas on appropriate species, culturing and enrichment planting techniques, or improved processing and marketing strategies which would enhance sustainability. It may be helpful to list all the strategies suggested and rank order or score them. In follow-up discussions with the community, this type of information can provide a basis for establishing management systems which allow for maximum sustainable yields of important products, taking into consideration changes in productivity over the course of natural forest succession. In Haryana, researchers asked foresters and community management groups (HRMS) to rank order their preferences for a range of forest development investment strategies. The exercise highlighted differences in perceptions regarding the value of species for enrichment planting and soil conservation technologies. Villages ranked bhabbar fiber grass the highest, while foresters ranked it twelfth. Foresters gave the highest rating to trenches for erosion control, while community members ranked trenches towards the bottom of the list. Identifying these differing perceptions of the relative values of various investment options provides a basis for a dialogue which may lead to a consensus regarding how development funds could be best utilized (see Figure 39).
Figure 39:
Forest Development Preferences of Hill Resource Management Societies
and FD Staff in Haryana
|
Soil & Water Conservation Technique |
HFD Preference Ranking |
HRMS Preference Ranking |
Combined Preference Ranking |
|
Agave |
5 |
22 |
16 |
|
Bamboo |
6 |
8 |
2 |
|
Bhabbar + Khair |
9 |
7 |
14 |
|
Bhabbar + Subabul |
10 |
6 |
4 |
|
Bhabbar |
12 |
1 |
1 |
|
Brush Checkdam |
16 |
19 |
21 |
|
Checkdams |
2 |
17 |
5 |
|
Chhal |
7 |
15 |
10 |
|
Churi |
18 |
16 |
20 |
|
Contour Bunds |
17 |
23 |
23 |
|
Dholu/Sarala + Fruit |
19 |
3 |
11 |
|
Dholu/Sarala |
13 |
2 |
3 |
|
Fruit: Ber |
21 |
14 |
22 |
|
Gabion Checkdams |
3 |
18 |
6 |
|
Guava |
22 |
4 |
15 |
|
Gully Plugs |
4 |
21 |
12 |
|
Jamun |
23 |
5 |
18 |
|
Jhoond + Fruit |
20 |
9 |
19 |
|
Jhood + Shisham |
11 |
10 |
7 |
|
Jhood |
14 |
11 |
13 |
|
Mendar/Karonda |
15 |
12 |
17 |
|
Prosopis |
8 |
13 |
8 |
|
Trenches |
1 |
20 |
9 |
The financial analysis component of the study would utilize case study data from forest plots at various stages of regeneration and under differing management regimes, as well as secondary data regarding the current benefits and costs of other FD-sponsored programs. The analysis would attempt to determine the macro-economic implications of shifting management from strict protection or timber production to sustained yield harvesting of a wide range of forest products. The valuation of forest products would likely be calculated by assessing predicted volume flows of selected commodities under different assumptions, including both natural productivity as well as enhanced productivity under a range of manipulation techniques.
Similarly, labor and capital requirements could be calculated. Based on the financial analysis of the benefits and costs of different management options, policy recommendations could be formulated for the consideration of government planners. To improve access of forest policy-makers and managers to the research findings, it would be important to involve them in the study from the design phase. Once per hectare production estimates and labor and capital requirements have been established, they could be multiplied by the area available to project. This information could be used to discuss the implications of various management alternatives with community members.
Forest Departments and communities entering into JFM agreements may want to consider a range of production options which respond to the socioeconomic and ecological conditions prevailing at the site. In making these decisions, they will need to examine the types of products, employment, and capital that would need to be available at various points of time in the future. For example, the JIM committee might decide to dedicate a part or all of the forest to timber production. A timber-oriented production system would require significant initial investments, while -the returns would largely occur at maturity, anywhere from 20 to 60 years later, depending on the species. For communities with labor constraints, but little need for immediate cash, this might be the most appropriate management system. Alternatively, the degraded or regenerating forest could be managed to maximize NTFP production, including fruits, flowers, nuts, seeds, leaves, and raw material for artisans. In this case, expenditures and returns would occur seasonally and annually over a long period. This option might be attractive for villages heavily dependent on NTFPs for subsistence and cottage industries. A third option might involve establishing soft wood industrial plantations on degraded lands. The expenditure would occur only in the first few years, and the returns would occur once every 8-15 years. In cases where industries provided good markets, this management regime might be acceptable. Another alternative might be the development of a fuelwood plantation for local use. This option would be attractive for potters and other artisan communities requiring a steady source of firewood. Annual thinning and lopping, starting after 3 or 4 years, followed by felling on a 6 or 7-year rotation with coppice regeneration, might provide the best alternative if fuelwood production needed to be maximized.
In attempting to select an appropriate management system, FD staff and communities win want to consider the ecological implications, as well as how forest management investments, expenditure, and returns will occur over a number of years. If all the expenditures and returns occur in one year for competing options, it is easy to decide on the option giving the highest net return for the year. Financial analysis attempts to project what the benefits and costs will be over longer periods.
It is more difficult to compare projects where costs and benefits accrue at different years. A rupee invested today will be worth more in the future as it earns interest, whereas a rupee received 10 years from now is worth less as it foregos earning investment interest. This concept describes "Present value" of future returns or expenditures. Calculating the present value of a future investment is called "discounting", as the payments to be received in future are discounted to the present. The benefit (or cost) occurring in year 'n' (5, 10 or 20 years later) has to be adjusted using an accepted time value of money. This time value of money is called the 'discount rate.' For example, suppose Rs 100 is invested at 8 % interest/year. The future value of that investment in year 1 is [Rs 100 x(1+0.08)] = Rs 108. The present value of Rs 100 received I year into the future is Rs 100/(1 +0.08) = Rs 92.59 because Rs. 92.59 invested today at 8% interest will grow to Rs 100 in a year's time. The Net Present Value or NPV is equal to the present value of returns minus the present value of costs. NPV is used widely as a project investment criteria.
Another commonly used measure of project worth is the Internal Rate of Return (IRR). IRR is the discount rate at which the NPV is zero i.e., the interest rate at which the Present Value of the project benefits equals PV of project costs. It is basically the break-even discount rate where PV benefits = PV of costs. Consequently, the higher the interest rate at which the NPV is zero, the more financially attractive the investment. This allows planners to compare the rate of return for the project with-bank interest rates. If the project is generating a higher rate of interest than banks are likely to give, it is a positive investment. The Benefit: Cost (B/C) Ratio is the ratio of present value of total benefits over the present value of total costs during the life of the investment. The ratio indicates the amount of benefits that the project generates per unit of investment in present value terms. A B/C ratio of one reflects a break- even point after discounting the interest lost during the period of investment. Anything above one reflects a positive return. Detailed methods and formulas for calculating Present and Net Present Values, IRR and Benefit : Cost Ratios are given in Appendix 3.
In Box 7, comparative financial analyses are illustrated using case study data for forests under NTFP production and firewood plantation systems. The cases illustrate how to calculate and compare NPV, IRR and B/C ratios. The study concludes that while the firewood plantation is a financially viable investment with an IRR of 15 % and a B/C of 1. 17, the NTFP option is more attractive with an IRR of 27% and a B/C of 2.53.
Box 7: Investment Comparison of NTFP Option with Firewood Option
|
A JFM program may have two options to consider for the degraded land a in village: 1) a short rotation firewood plantation or 2) an NTFP-yielding forest. Firewood Plantation: A eucalyptus plantation can be harvested every 6 years. The total annual expenditure or cost per ha. is given in Appendix 4, Table A, as well as the annual return from sale of twigs and firewood (once every 6 years). The net return is estimated for each year and is converted to present value in year "0" at 12% interest or discount rate. NPV for the 20-year cycle is estimated to be Rs. 1324.07 per ha. Benefit: Cost Ratio = PV of total benefits/PV of total costs = 8798.2/7473.2 = 1.17 IRR: NPV was estimated for 12%, 15% and 16%. NPV becomes negative at 16%. It was positive at 15%. Therefore IRR lies between 15 and 16%. Thus IRR could be taken as 15%. NTFP FOREST OPTION: A forest which includes trees like jack fruit, karanj, jamun, tamarind and mahua has a density of 400 trees/ha. The annual total cost and returns are given in Appendix 4, Table B. The net return and PV of net returns for each year are estimated at 12% discount rate. NPV = Rs. 8597.6 (sum of all PV of returns) Benefit: Cost Ratio = PV of benefits/PV of total costs = 19765/7801 = 2.53 IRR: NPV was estimated for 12%, 18%, 24%, 27% and 28%. NPV was negative at 28% and was positive at 27%. IRR would be between 27% and 28%. Thus IRR could be taken as 27%. Management Decisions: NPV and IRR have been estimated for both the firewood plantation and NTFP forest. At 12% interest rate NPV for both the options is positive. Thus both the options are profitable at 12% discount rate. The NPV value for NTFP option and only 15% for the firewood plantation option. The benefit: cost ratio for the NTFP option is 2.53 compared to 1.17 for the firewood plantation option. Thus, the local JFM can clearly decide in favour of the NTFP forest option. |